Your site can pass every Lighthouse audit on your laptop and still feel slow to the people who use it. Lab tests run on one device, one network and one location. Your visitors arrive on older phones, congested mobile networks and browser versions you never tested.
Frontend monitoring closes that gap. It collects performance and error data from live browser sessions, so you can see how pages load, where JavaScript breaks and which interactions lag for actual users. This field-data approach is also called real user monitoring (RUM), and it shows your Core Web Vitals the way your visitors experience them, page by page and session by session.
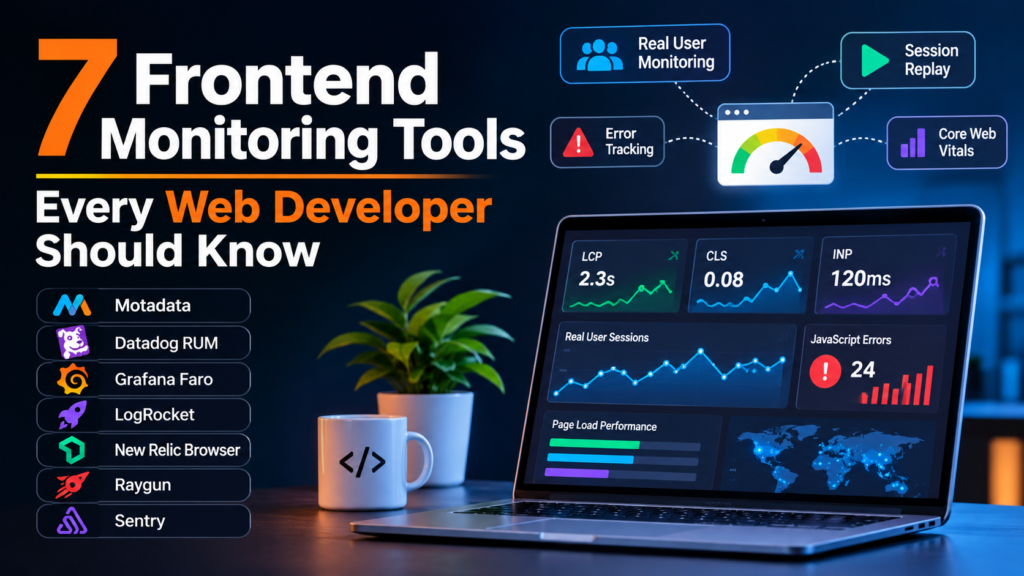
The seven tools in this guide all capture that browser data, but they differ in depth, framework support and how well they connect a slow page to the backend call behind it. For each one, you will see what it does well, where it falls short and which kind of team it suits.
How Were These Tools Chosen?
Each tool on this list was checked against the vendor’s own documentation for six things that matter to web developers:
- Framework support: SDKs or integrations for React, Next.js, Vue or Angular, including single-page app routing.
- Core Web Vitals: Field measurement of LCP, CLS and INP, which replaced FID as a Core Web Vital in March 2024.
- JavaScript errors: Stack traces you can read, ideally with source map support for minified bundles.
- Session context: Session replay or a session explorer that shows what the user did before a problem appeared.
- Backend correlation: A link from a slow page or failed request to the API call, trace or log behind it.
- Pricing model: Whether a free tier or trial exists, and what drives cost as traffic grows.
Which Frontend Monitoring Tools Should You Consider?
1. Motadata
Motadata’s real user monitoring is part of ObserveOps, its unified observability platform. It tracks Core Web Vitals such as LCP, FCP, CLS and INP across browsers, devices and regions. It also records JavaScript errors, slow resources, long tasks and layout shifts as they happen inside user sessions.
The main advantage for developers is how far one investigation can go. You can open a session in the Session Explorer, replay it, inspect a frontend flame chart and then follow the request into the backend trace, logs and infrastructure metrics behind it. Tracing is OpenTelemetry-native, framework support covers React, Next.js, Vue and Angular, and privacy controls include session sampling and input masking.
Trade-off: RUM sits inside a broader platform, so a team that only wants a lightweight browser script may find the setup larger than it needs. Pricing is not published, so you will need a quote.
Best for: Teams that want frontend, backend and infrastructure data in the same place.
Pricing: Free trial available, with pricing on request.
2. Datadog RUM
Datadog RUM tracks Core Web Vitals and groups frontend errors into issues with readable stack traces, sorted by release, device and affected users. Its browser SDK has plugins for React, Next.js, Vue, Angular and Nuxt, and Datadog publishes setup guides for both the Next.js App Router and Pages Router.
Network requests from the browser link to backend APM traces and logs, so you can move from a slow session to the service that caused it. Session replay and heatmaps are also available, with user inputs masked by default.
Trade-off: Session replay is billed as an add-on, and RUM gives the most value when the rest of your stack already runs on Datadog. Costs grow with session volume.
Best for: Teams already using Datadog for APM and logs.
Pricing: Billed per 1,000 sessions, with a free trial available.
3. Grafana Faro
Grafana Faro is an open-source web SDK for real user monitoring. It captures web vitals, unhandled errors mapped back to source code, sessions, frontend logs and OpenTelemetry traces, and it has a dedicated React integration. Data flows to Loki for logs and Tempo for traces, where Grafana can correlate it with your backend data.
You can self-host the full stack or send data to Grafana Cloud Frontend Observability. Session replay entered public preview on Grafana Cloud in August 2026.
Trade-off: Self-hosting means running the collector and storage yourself, and session replay is still in preview.
Best for: Teams already on the Grafana stack, or teams that want an open-source SDK.
Pricing: The SDK is free. The Grafana Cloud free tier includes 50,000 frontend sessions per month, and the Pro plan charges $0.75 per 1,000 sessions after that.
4. LogRocket
LogRocket started as a session replay tool and has built frontend monitoring around it. Its performance monitoring tracks web vitals such as LCP and CLS, plus CPU and memory usage, network request duration and page load. You can drill from any chart into the individual sessions behind a spike, and alerts can go to email, Slack, PagerDuty or a webhook.
The Pro plan adds Galileo AI features such as session summaries and issue detection. These help when you have far more sessions than anyone on the team can watch.
Trade-off: LogRocket leans toward user experience and product analytics rather than backend correlation, and pricing climbs as session volume grows. Its performance page still lists first input delay, so confirm INP reporting during your trial.
Best for: Frontend and product teams who debug through replays.
Pricing: 14-day free trial, with session-based plans starting at $176 per month billed annually.
5. New Relic Browser
New Relic Browser flags pages with underperforming Core Web Vitals and compares source maps with stack traces, so minified errors point back to your original code. It also tracks error rates after each deployment and can collect console logs on demand.
Browser data connects to backend code through distributed tracing. New Relic also offers session replay as a separate capability on the same platform.
Trade-off: Ingest-based pricing can be hard to forecast as traffic grows, and the platform takes time to learn.
Best for: Teams that want a generous free tier and full-stack data on one platform.
Pricing: The free tier includes 100 GB of data ingest per month and one full platform user.
6. Raygun
Raygun Real User Monitoring tracks Core Web Vitals, lets you inspect individual sessions with diagnostics for each page request, and shows the impact of every deployment as it rolls out. It supports JavaScript, React and Angular, and its documentation includes a dedicated guide for single-page apps.
Raygun pairs RUM with its Crash Reporting and APM products, so errors and server-side performance sit next to your frontend data.
Trade-off: Raygun does not list session replay, and Crash Reporting is priced as a separate product.
Best for: Teams that want simple pricing tied to session volume.
Pricing: 14-day free trial, with plans from $80 per month billed annually for 100,000 sessions.
7. Sentry
Sentry is best known for error tracking, and many development teams already use it. Its SDKs cover React, Next.js, Vue and Angular, and it includes a Web Vitals dashboard, tracing and session replay in the same product.
Because errors, traces and replays come from one SDK, you can open an error and watch the session that triggered it.
Trade-off: The free and entry paid plans include only 50 session replays per month, so replay-heavy teams will pay more. Its user experience analytics are lighter than those of replay-first tools.
Best for: Developer teams that want errors, tracing and replay in one SDK.
Pricing: The free Developer plan includes 5,000 errors and 50 replays per month, and the Team plan starts at $26 per month billed annually.
Quick Comparison
| Tool | Framework support | Session replay | Backend trace link | Free option |
| Motadata | React, Next.js, Vue, Angular | Yes | Yes, traces, logs and infrastructure | Free trial |
| Datadog RUM | React, Next.js, Vue, Angular, Nuxt | Add-on | Yes, APM traces and logs | Free trial |
| Grafana Faro | React, plus any web app via the SDK | Public preview on Grafana Cloud | Yes, through Tempo | 50,000 sessions per month |
| LogRocket | JavaScript web apps | Yes, core feature | Not the main focus | 14-day trial |
| New Relic Browser | JavaScript web apps | Yes, separate capability | Yes, distributed tracing | 100 GB per month |
| Raygun | JavaScript, React, Angular | Not listed | Yes, with Raygun APM | 14-day trial |
| Sentry | React, Next.js, Vue, Angular | Yes | Yes, tracing | Free Developer plan |
Pricing and plan details were checked against each vendor’s site in November 2026.
How Do You Pick the Right Tool for Your Stack?
Start with where your backend data already lives. If your APIs are traced in Datadog, New Relic or Grafana, that vendor’s frontend tool will connect a slow page to its backend cause with the least extra setup. If your backend monitoring is scattered across several tools, a platform that holds frontend, backend and infrastructure data together removes the need to jump between dashboards during an incident.
Then work through these checks before you commit:
- Framework and routing support: Confirm the SDK handles route changes in your single-page app, or your page-level metrics will be wrong.
- Replay needs: Decide whether your team debugs mainly from stack traces or from watching sessions, since replay often drives cost.
- Cost at your traffic: Model your monthly sessions or data volume against each pricing model, because per-session and per-GB pricing scale differently.
- Privacy controls: Check input masking and sampling options before you record sessions on pages that handle personal data.
Finally, run a trial on one production page. Check that INP appears in the dashboard and that a minified error maps back to readable source code. Those two tests will tell you more than any feature list.